“Quantitative Naturwissenschaften”
→ Python
Ich zeige Euch heute “was ihr eigentlich noch nicht wissen dürft”
(Zitat Ende – frei adaptiert ...)
You don't learn programming by learning a programming language.
Languages are tools that allow you to do something you’ve already learned - situational analysis, also known as programming.
(Programming isn’t typing things into a computer, it’s thinking.)
Al Klein, 45 years of earning a living developing systems.
Was ist ein Computer ? Was ist ein Compiler ? Was ist “high-level”-Programmierung ?
https://docs.python.org/3/tutorial
Python ist eine “schöne” Programmiersprache
Python ist strukturiert:
Python ist flexibel
Python ist ready-to-go …
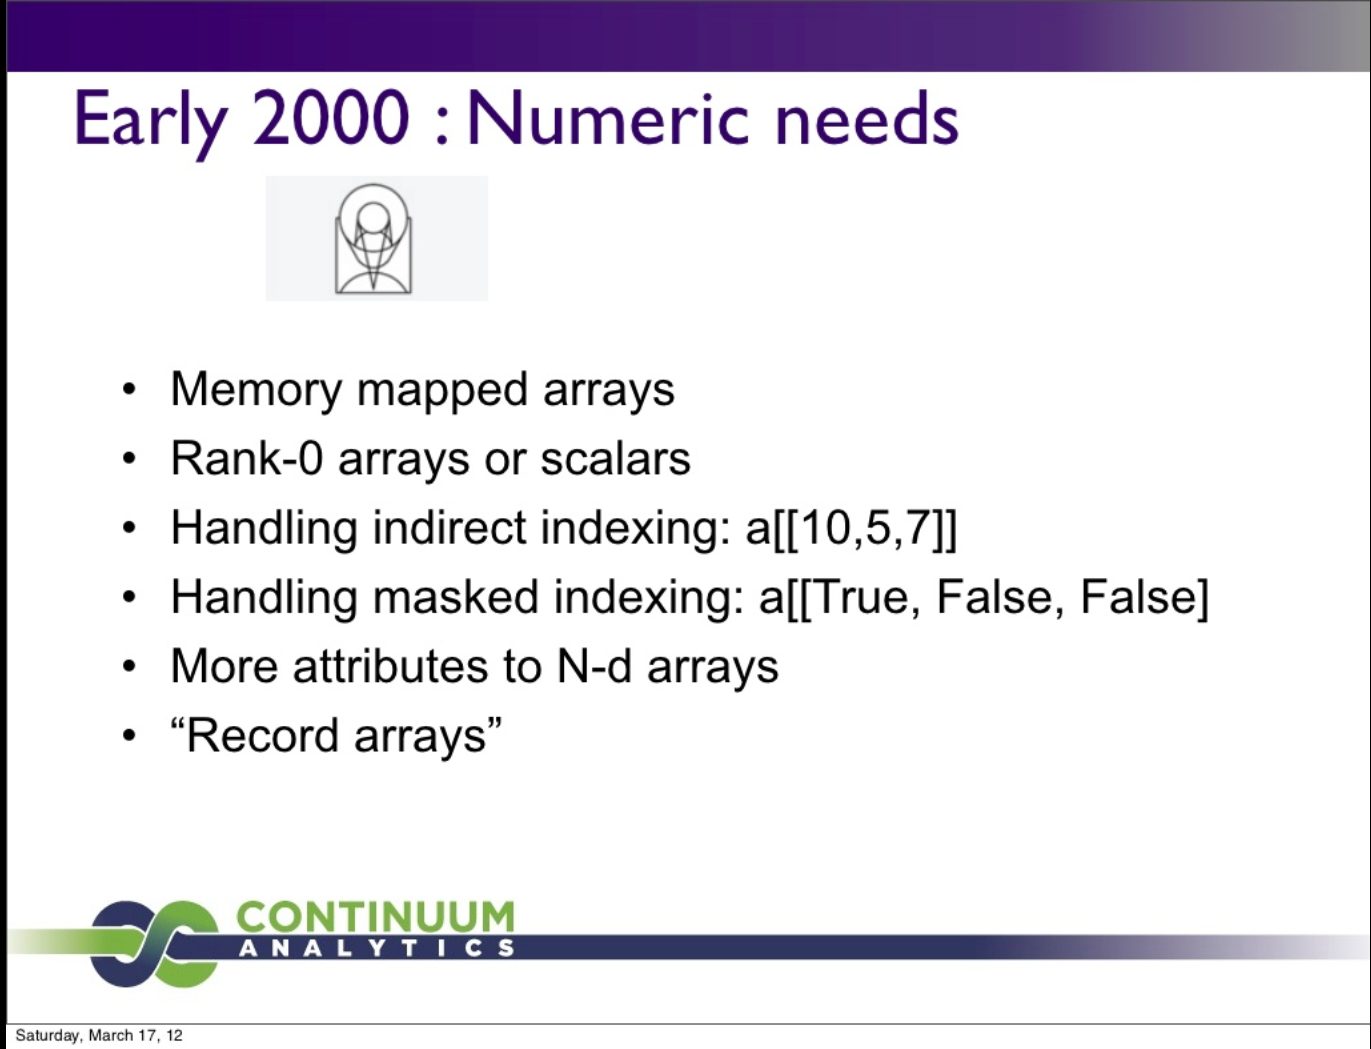
Python 1994
Numpy 2005 Numeric 1998? Numarray 2001?
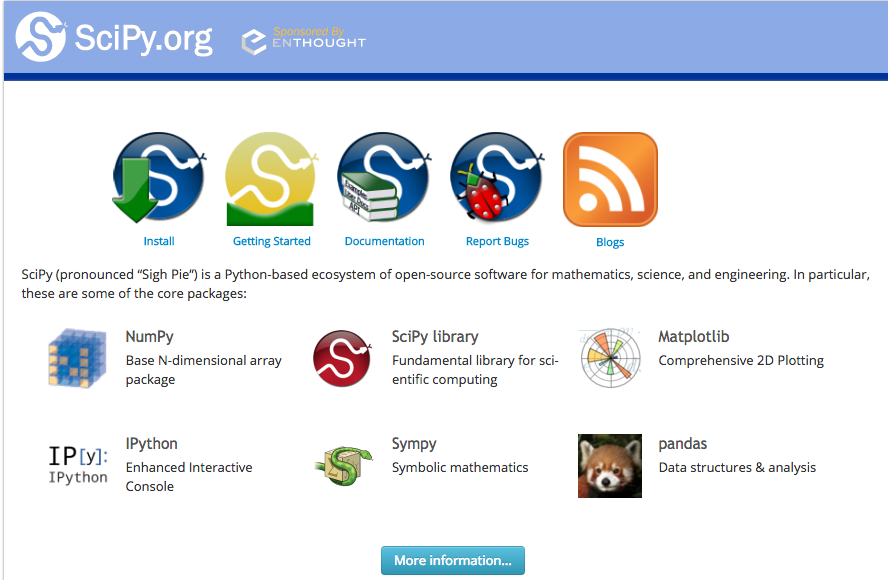
SciPy 2001
AstroPy
Priithon Meins… http://msg.ucsf.edu/sedat/Priithon/PriithonHandbook.html
PyTables
SymPy
http://www.sympy.org/en/index.html
Gamma !
http://www.sympygamma.com/input/?i=integrate%28log%28x%29%2C+%28x%2C+1%2C+a%29%29
5**5**5
There are a few guidelines one has to realize when using Python:
Nochmal…
range(5) fängt bei 0 an hört VOR 5 auf also [0,1,2,3,4]
range(0, 5, 2) ? [0, 2, 4]
Argumente können auch als Keyword-Argument übergeben werden …. Macht Code oft lesbarer !!
N.arange(5, step=.5)
array([ 0. , 0.5, 1. , 1.5, 2. , 2.5, 3. , 3.5, 4. , 4.5])
(Ausnahme: built-in range(10,step=2) → TypeError: range() takes no keyword arguments )
List-Comprehensions sind sehr praktisch: [ x**2 for x in range(10 if x%2 ==0 ]
Praktisches print – bzw. praktische Strings:
“-” * 80
print(3,4,5, sep=’ - ‘) # übrigens ‘ ist identisch zu “ und “”” und ‘’’ sind gut für mehrzeilige Strings
Travis E. Oliphant, "NumPy and SciPy: History and Ideas for the Future"
https://www.slideshare.net/shoheihido/sci-pyhistory
NumPy and SciPy for Data Mining and Data Analysis Including iPython, SciKits, and matplotlib
http://scipy-cookbook.readthedocs.io/
https://www.dataquest.io/blog/numpy-tutorial-python/
https://jakevdp.github.io/PythonDataScienceHandbook/02.07-fancy-indexing.html
Und nochmal…
Python Assignment != memory-copy / CPU-work
b = a # no work ! same object !
b[:] = a # work !
Numpy:
Zeilen-Vektoren Spalten-Vektoren
Broadcasting ….
a=np.arange(5)
a[ [0,0,1,0,1] = 99
%timeit numpy ….
Jupyter
https://blog.dominodatalab.com/lesser-known-ways-of-using-notebooks/
z.B.
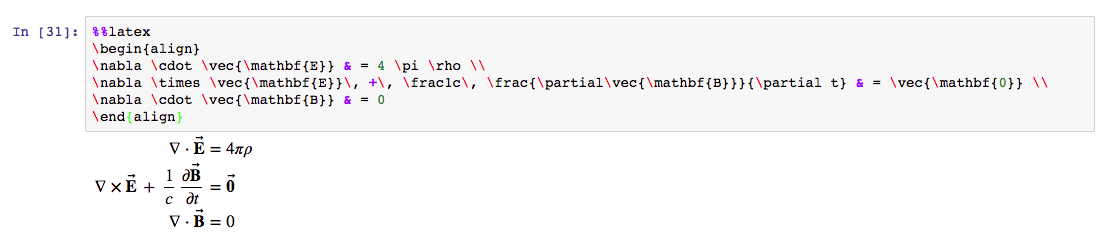
%%latex
\begin{align}
\nabla \cdot \vec{\mathbf{E}} & = 4 \pi \rho \\
\nabla \times \vec{\mathbf{E}}\, +\, \frac1c\, \frac{\partial\vec{\mathbf{B}}}{\partial t} & = \vec{\mathbf{0}} \\
\nabla \cdot \vec{\mathbf{B}} & = 0
\end{align}
https://www.python-course.eu/numpy.php
Swap rows: a[2], a[1] = a[1], a[2].copy() # .copy() weil zwischendurch überschrieben!!
https://stackoverflow.com/questions/14933577/swap-slices-of-numpy-arrays/14933939#14933939
http://jakevdp.github.io/blog/2013/06/15/numba-vs-cython-take-2/
https://github.com/matplotlib/matplotlib/blob/master/lib/matplotlib/__init__.py
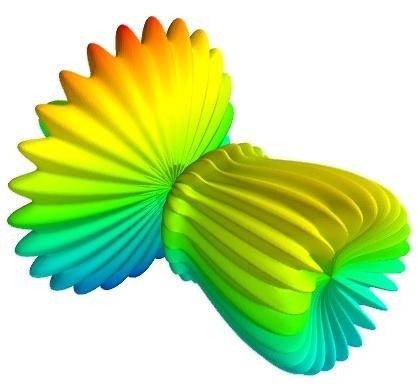
Mayavi
To get you started, here is a pretty example showing a spherical harmonic as a surface:
# Create the data.
from numpy import pi, sin, cos, mgrid
dphi, dtheta = pi/250.0, pi/250.0
[phi,theta] = mgrid[0:pi+dphi*1.5:dphi,0:2*pi+dtheta*1.5:dtheta]
m0 = 4; m1 = 3; m2 = 2; m3 = 3; m4 = 6; m5 = 2; m6 = 6; m7 = 4;
r = sin(m0*phi)**m1 + cos(m2*phi)**m3 + sin(m4*theta)**m5 + cos(m6*theta)**m7
x = r*sin(phi)*cos(theta)
y = r*cos(phi)
z = r*sin(phi)*sin(theta)
# View it.
from mayavi import mlab
s = mlab.mesh(x, y, z)
mlab.show()
Bulk of the code in the above example is to create the data. One line suffices to visualize it. This produces the following visualization: